

Bet the data, not the vibes.
Everything a winning prop bettor needs. Matchup data that goes deep, research that takes seconds.
Odds compared across 40+ sportsbooks, including Sleeper, FanDuel, DraftKings, BetMGM, Caesars, ESPN Bet, bet365 and Fanatics.
The tools


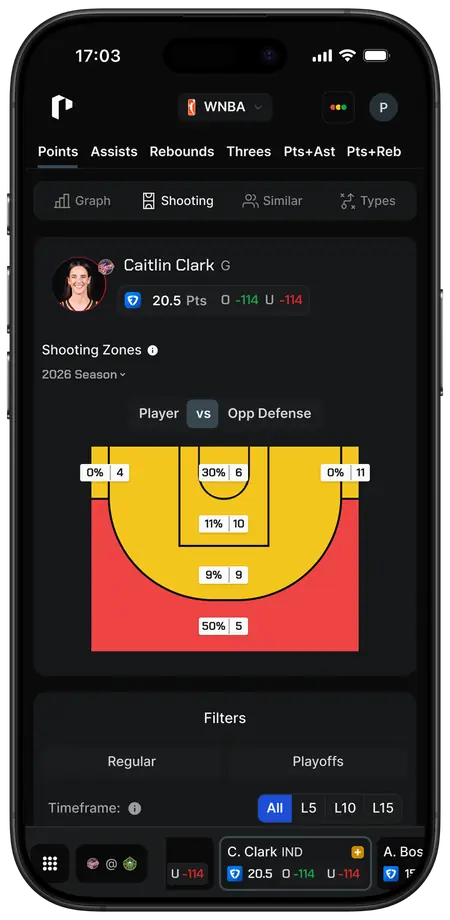
Matchup Analyzer
Pitcher vs batter, settled by the numbers
Percentile rankings, hand splits and head-to-head history behind every prop. Every pitcher and batter stat is ranked against the rest of the league.
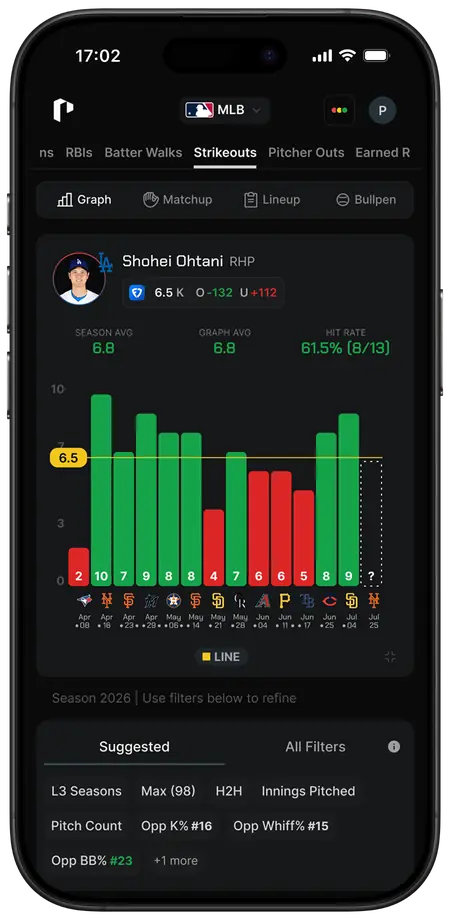
Hit-Rate Charts
See how often it actually cashed
Every line plotted against real game logs. Toggle a filter and the chart recomputes the hit rate instantly. You back the number, not the narrative.


 32.5O−110U−110


 267.5O-110U-110


Line Shopper
Never take a worse number
Odds from 40+ sportsbooks side by side, refreshed every few seconds. Pick your books and always bet the best available price.
How it works
Three steps between a hunch and a decision you can defend.
In this walkthrough, Pips, a professional sports bettor, runs through his full PropsMadness research process for two MLB markets: home runs and strikeouts. He opens by checking his tracked results on an outside tracker, where his home run bets have run at a 7% ROI over the past two months.
For home runs, he starts on the slate-wide home run environment reading for each game and skips anything strongly negative, favoring matchups closer to neutral or positive. From there he checks the opposing starter's home run and barrel rate allowed, looking for pitchers trending worse lately even if their season numbers look average.
His featured example is a hitter facing a struggling starter with weak home run prevention. Breaking the pitcher's arsenal down by pitch type shows the batter grades in the 90th-plus percentile against exactly the two pitches that starter throws most, while the pitcher barely throws the one pitch the batter handles worst.
He layers on more context: the hitter's plate appearances per game have climbed as he's moved up the batting order, his rolling home-run rate is far outpacing his season average, and in games with a similar park/weather environment to this one he's already homered in 10 of his last 16. He closes the pick by comparing odds across books to find the best price before betting.
Switching to strikeouts, his first example is a starter pitching in a favorable park who faces a lineup that's strong against right-handed pitching overall but ranks near the bottom against left-handers specifically. Filtering the pitcher's own game log to only the match ranked opponents shows his strikeout rate collapsing well under the posted line in that split.
A second strikeout example uses a full three-season sample for a different starter: filtered down to games against bottom-tier strikeout matchups, he clears the line in the large majority of starts, while the same filter against tougher lineups shows the exact opposite. The takeaway he leaves viewers with: the matchup-specific filtering is what turns a season average into an actual edge.
Four leagues, one workflow
The same research depth in every league. MLB and WNBA are live right now, the rest the day their season opens.


Proof
“Can tell the people behind it are in it themselves and work hard to provide a great product… If you use PropsMadness for a couple hours it becomes obvious.”Stadio · Trustpilot

Start free. Upgrade when it pays for itself.
No card to browse the free tier. Pro unlocks every player in every league.
Affiliates
 Daft Previews41K+ subs
 Just A Bet Outside45K+ subs
 PropBomb150K+ followers
 Land Your Bets30K+ subs
 Calling Our Shot220K+ subs
 MJC Locks115K+ followers
 Noah Picks70K+ subs
 In The Green DFS34K+ subs
 Prop Ant33K+ followers
 Spencer Picks32K+ followers
 Goated Gambler30K+ followers
 Cheese Picks26K+ subs
 WizBetz24K+ followers
 JediModi Sports22K+ subs
 Straight Bettin'20K+ followers
 El Guru5K+ followers
Frequently asked questions
Bet the data. Not the vibes.
Browse a few players for free. No signup, no credit card. Upgrade when it pays for itself.